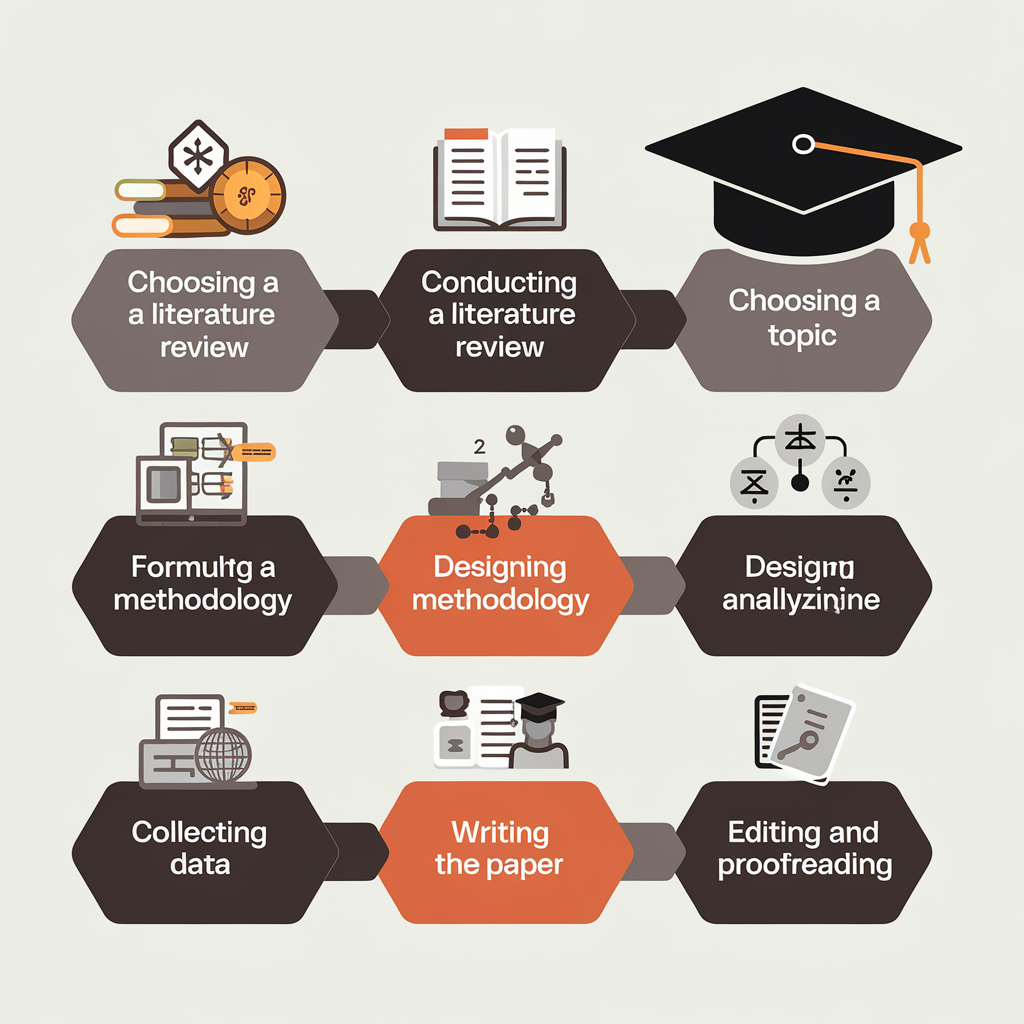
Statistical Package for Social Sciences

SPSS is a popular statistical analysis software package, which stands for Statistical Package for Social Sciences. It is one of the more popular tools in contemporary statistical analysis due to its easy to use Graphical user interface, although it offers a wide range of capabilities ranging from add-on modules to add-on packages such as Amos and Clementine. SPSS was first developed in 1968 and has since been used extensively in industry and university research applications.
SPSS statistics is a software package used for logical batched and non-batched statistical analysis. This software is one of the most popular statistical packages which can perform highly complex data manipulation and analysis with simple instructions. SPSS can take data from almost any type of file and use them to generate tabulated reports, charts and plots of distributions and trends, descriptive statistics and conduct complex statistical analyses. These packages of program is available for both personal and mainframe computers.
SPSS is beneficial for both qualitative and quantitative data equal importance is being given for both data sets, about 85% of the research scholars carry quantitative data for their further analysis, so the layman thinks that the SPSS software is more beneficial in quantitative data than qualitative one but no SPSS gives equal weight age for both data sets. Even if there are several software’s available in market to analyze quantitative data SPSS is more preferable than other software’s. Since SPSS is user friendly software & ease to use for the beginners and also helps in analysis even when the data set goes larger.
How it is benefit for research scholars?
Mainly for the research scholars who are versatile in their own core papers and quite weak in software part can prefer SPSS software for their further analysis as SPSS gives a perfect graphical representation and also an appropriate result for the data that has been entered. SPSS is just a drag and drop process which has almost all basic and some advanced statistical analysis which helps the research scholars to easily adapt to this software and can do the analysis part and attain their result.
SPSS software can read and write data from other statistical packages, databases, and spreadsheets. When entering data into the software, one has to click on “variable view.” The variable view enables the user to customize it by data type and consists of the following headings: Name, Type, Width, Decimals, Label, Values, Missing, Columns, Align, and Measures. These headings enable the user to characterize the data.
SPSS is most often used in social science fields such as psychology, where statistical techniques are involved at a large scale. In the field of psychology, techniques such as cross tabulation, t-test, chi square test, etc., are available in the “analyze” menu of the software.
There is also an option in the software called “split file,” which is given in the “data” menu. This option is very useful for researchers who are performing comparative studies. Suppose researchers want to know the literacy rate of three regions. In this case, the split file option will help them get the result of three regions separately so that they can interpret and compare the literacy rate of the three regions.
SPSS software has a technique called missing value analysis, and this technique helps in making better decisions about the data. This technique enables the user to fill in the missing blanks in order to create better models to estimate the data. The analysis provides the user with procedures for data management and preparation.
SPSS involves some sophisticated inferential and multivariate statistical procedures such as factor analysis, discriminate analysis, analysis of variance, etc. SPSS, as the name suggests, is software for performing statistical procedures in the social sciences field. The major limitation of SPSS is that it cannot be used to analyze a very large data set. A researcher often gets a large data set in the field of medicine and nursing, so in those fields, the researcher generally uses SAS instead of SPSS to analyze the clinical data.
Data Collection and Organization
SPSS is often used as a data collection tool by researchers. The data entry screen in SPSS looks much like any other spreadsheet software. You can enter variables and quantitative data and save the file as a data file. Furthermore, you can organize your data in SPSS by assigning properties to different variables. For example, you can designate a variable as a nominal variable, and that information is stored in SPSS. The next time you access the data file, which could be weeks, months or even years, you’ll be able to see exactly how your data is organized.
Data Output
Once data is collected and entered into the data sheet in SPSS, you can create an output file from the data. For example, you can create frequency distributions of your data to determine whether your data set is normally distributed. The frequency distribution is displayed in an output file. You can export items from the output file and place them into a research article you’re writing. Therefore, instead of recreating a table or graph, you can take the table or graph directly from the data output file from SPSS.
Statistical Tests
The most obvious use for SPSS is to use the software to run statistical tests. SPSS has all of the most widely used statistical tests built-in to the software. Therefore, you won’t have to do any mathematical equations by hand. Once you run a statistical test, all associated outputs are displayed in the data output file. You can also transform your data by performing advanced statistical transformations. This is especially useful for data that is not normally distributed.
The key selling point of SPSS is its expansive data analysis options. A wide range of data analysis functions can be performed using SPSS, including hypothesis testing, frequencies, crosstabs, T-test, ANOVA, correlation, (linear as well nonlinear), cluster analysis, factor analysis, discriminant analysis, missing value analysis, time series forecasting etc.
however, what makes it even better is how these functions are automated to the point that one need simply select the relevant variables and corresponding applications for output and analysis (where necessary), and SPSS does the rest.
In the context of SPSS, it’s important to mention that using AMOS and Clementine, two of its’ most popular add-on packages (not modules), one can access the high end functionality within SPSS. While Amos is used for Structured Equation modeling and Path analysis, Clementine is a high end data mining package. Amos is probably one of the simplest and easiest to use Path analysis software’s available. Each chain of variables can be dynamically ‘graphed’ without going into programming, with the results available near-on-the-fly.